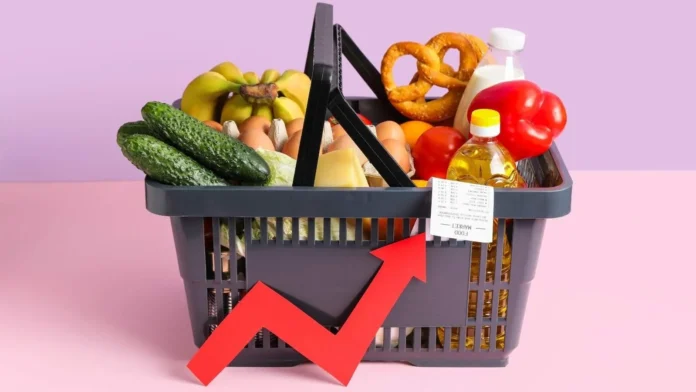

New US government price data shows annual inflation accelerating to 3.8% in April 2026 — the fastest pace since May 2023 — driven by surging energy costs from the Iran war and the Strait of Hormuz closure, with core inflation also rising at its hottest level in years, signalling that price pressures are spreading beyond the energy sector.
Americans don’t need a press release to know that inflation is rising. Gasoline is above $4 per gallon amid the ongoing conflict in the Middle East and closure of the Strait of Hormuz, and the release of key price data on May 28, 2026, underscores why policymakers are worried these pressures could spread into the broader economy.
Prices rose 3.8% in April compared to a year earlier, marking an increase from a year-over-year inflation rate of 3.3% in the prior month. Annual inflation jumped to its highest level in three years, Bureau of Labor Statistics data showed.
The average price for a gallon of petrol in the United States was $4.50 as of May 12, with prices surging higher in states like California, Ohio and Arizona. As of Thursday, AAA data put the national average at $4.42 — still elevated above $4 for the first time since 2022, making every fill-up a visible, unavoidable reminder of the war’s economic consequences.
From Energy Prices to Broader Inflation
The progression of US inflation since the Iran war began is a textbook case of how an energy shock moves through an economy — and the data now shows it has moved well beyond the energy sector.
In February 2026, the month the war began, the annual US inflation rate stood at 2.4% — a figure that had taken two years of Federal Reserve tightening and post-pandemic supply chain normalisation to achieve. By March, the annual rate had jumped to 3.3%, driven primarily by higher energy costs linked to the war with Iran, alongside the continued pass-through of tariffs into consumer prices. The national average price of gasoline climbed above $4 per gallon for the first time in more than three years.
By April, the rate had risen further to 3.8%. US consumer prices rose by 0.6% in April after a 0.9% increase in March. The surge in energy prices included a 5.4% monthly increase in gasoline prices.
The month-on-month acceleration — 0.9% in March, 0.6% in April — suggests the rate of energy price increase is slowing, which would be consistent with markets partially adjusting to the Hormuz closure. But the year-on-year headline rate continues to rise because each new month now compares against a period when prices were substantially lower.
Why Core Inflation Is the Number That Worries the Fed
The headline inflation number — 3.8% — tells part of the story. The more concerning figure for Federal Reserve policymakers is the core reading.
The release of key price data offered a mixed but still uncomfortable picture. The month-to-month rise was softer than expected, but the change year over year still points to concern: a 3.8% jump from a year earlier, the fastest pace since 2021, and a less volatile index that excludes food and energy up 3.3%. This increase suggests inflation isn’t limited to gasoline. Housing, utilities and recreational spending are also keeping underlying inflation elevated, even as other data shows a slowing economy and weaker income growth.
Core inflation — the measure that strips out the volatile food and energy categories to give a cleaner read of underlying price dynamics — running at 3.3% is a significant signal. It means that the price increases being driven by the Iran war’s energy shock are beginning to spread into the broader economy through mechanisms that are harder to reverse quickly.
When energy costs rise, they affect virtually every economic activity: transport becomes more expensive, which raises the cost of delivering goods; manufacturing with high energy inputs becomes more expensive, which raises production costs; heating and cooling buildings becomes more expensive, which affects service industry margins. Those secondary price increases show up in core inflation — and they are now doing so in the US data.
The Federal Reserve’s preferred inflation measure is the Personal Consumption Expenditures Price Index rather than the CPI. Headline PCE had already been getting hotter, rising to 3.5% year on year in March 2026, up from 2.8% in February. Core PCE, which excludes the more volatile categories of food and energy, is a key metric for the Fed.
The Federal Reserve’s Impossible Position
The Iran war has placed the Federal Reserve in one of the most difficult positions it has faced since the post-pandemic inflation surge of 2021-2022.
In the months before the war, the Fed had been expected to continue cutting interest rates through 2026. The US economy was growing moderately, inflation had been brought close to the 2% target, and the case for further rate cuts to support growth was building.
The war changed that calculation in two simultaneous ways. Energy prices — rising due to the Hormuz closure — are pushing inflation higher. At the same time, the uncertainty created by the war, the hit to consumer confidence, and the broader economic disruption are weighing on growth. The US economy is not in recession — at least not yet — but the combination of above-target inflation and below-trend growth is precisely the “stagflationary” environment that is hardest for central banks to navigate.
If the Fed cuts rates to support growth, it risks allowing inflation to become more entrenched. If it holds rates or raises them to fight inflation, it risks tipping an already slowing economy into recession. Neither option is good, and the right answer depends heavily on how long the Iran war and Hormuz closure last — a variable that is determined by geopolitics rather than economics.
In our 2026 economic outlook, we warned that recession fears could persist alongside rising prices. Fresh inflation data now suggests the challenge may be deeper and longer lasting than many expected.
The Household Impact
Behind the macroeconomic data are the costs absorbed by individual households. The $4.42 national average gas price — compared to roughly $3.10 before the war — represents a meaningful additional cost for the tens of millions of American households that depend on private vehicle transport. For a household driving 15,000 miles per year in a vehicle averaging 25 miles per gallon, the increase means roughly $800 more per year in fuel costs alone.
Housing costs, which make up the largest single category in the US consumer price index, were already elevated before the war due to the combination of high mortgage rates and limited housing supply. Utilities — which are directly affected by energy price movements — have risen. Food costs have also edged up, reflecting the energy-intensive nature of food production, processing, and distribution.
The burden is not evenly distributed. Households at lower income levels spend a larger proportion of their budgets on energy and food than higher-income households — meaning the Iran war’s inflation impact falls disproportionately on those least able to absorb it.
What Could Change the Trajectory
The inflation trajectory is directly linked to the Hormuz negotiations. A diplomatic settlement that reopens the strait and begins normalising oil flows would put downward pressure on energy prices relatively quickly — likely within weeks of a credible, verified reopening. That in turn would reduce the energy component of inflation and, over several months, begin to ease some of the secondary price pressures now showing up in core readings.
If the ceasefire holds and talks proceed this weekend, that path remains possible. If the ceasefire collapses — as the overnight Iran-Kuwait missile exchange threatened — the energy price trajectory would diverge significantly, potentially pushing prices well above current levels.
For now, the data says what it says: US inflation is at a three-year high. Core prices are rising at their fastest pace since 2021. The war that caused it has not ended. And the Federal Reserve, watching all of this, has no clean choices.
LoudFact.com is an independent global news and explainer platform. This report is based on reporting from The Conversation, Al Jazeera, ABC News, AAA, and Trading Economics as of May 28-29, 2026.